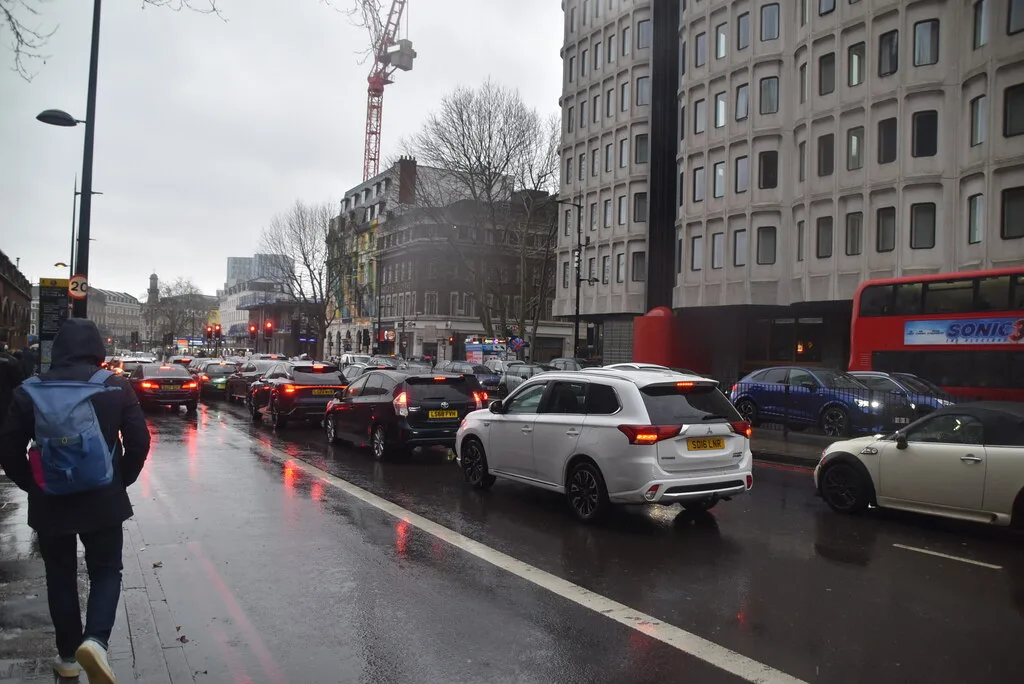

Boilers cause 38.6% of Camden's nitrogen oxides, ahead of traffic on 22%. Only three monitoring sites still break the legal NO2 limit, all on Euston Road.
Boilers, not cars, are now the largest source of nitrogen dioxide in Camden. Heating buildings accounts for 38.6 per cent of the borough’s nitrogen oxide emissions. Road transport accounts for 22 per cent.
That figure is in the council’s draft Clean Air Action Plan 2027-2030, which is open for public comment until Sunday 13 September. It sits alongside Camden’s air quality Annual Status Report for 2025, which the council published on 1 September.
The headline from both is genuine progress. Nitrogen dioxide across Camden’s automatic monitors fell 6 per cent on 2024. The council’s own data also shows how far the borough still is from the standard it has set itself, and how much of the remaining problem is no longer about traffic at all.
Three streets are still over the legal limit
Camden had 337 diffusion tube monitoring sites with enough data to count in 2025. Three recorded more than the 40 µg/m³ legal limit for nitrogen dioxide. We checked the council’s diffusion tube open data and confirmed the three, all of them on Euston Road:
| Monitoring site | Ward | 2024 | 2025 |
|---|---|---|---|
| Euston Road at Judd Street | King’s Cross | 41.9 | 44.2 |
| Euston Road, beside the automatic monitor | Bloomsbury | 44.2 | 41.5 |
| Pancras Road at the Euston Road junction | King’s Cross | 33.3 | 41.4 |
Figures are annual mean nitrogen dioxide in micrograms per cubic metre. The legal limit is 40.
Two things stand out. The Judd Street site got worse, not better. And the Pancras Road junction went from comfortably legal to over the limit in a single year, a jump of 8.1 µg/m³.
The next worst readings in the borough were Shaftesbury Avenue north on 38.4, Midland Road at Pancras Road on 38.1, and Kilburn High Road opposite the Overground station on 36.4. All three improved on 2024.
The cleanest air the council measured was at Christchurch Primary School on Christchurch Hill in Hampstead, on 12.9. Frognal Way and Laurier Road in Highgate were next.
What actually happened on Camden High Street
The council’s stand-out claim is Camden Town. The automatic monitoring station on Camden High Street recorded 19 µg/m³ in 2025, down from 26 in 2024. That is a 27 per cent fall, and Cllr James Slater, cabinet member for planning and a sustainable Camden, attributes it directly to the trial pedestrianisation that started in May 2025.
The tube readings back that up on the closed stretch itself. Every tube on Camden High Street fell or held steady:
- Camden High Street, outside Camden News: 23.4 down to 19.7
- Camden High Street, outside American Candy: 25.1 down to 22.6
- Britannia Junction: 32.5 down to 30.3
- Camden High Street, at Camden Market: 22.2 down to 22.0
Six tubes on the streets around it moved the other way:
- Kentish Town Road south: 23.4 up to 27.5
- Hawley Crescent: 21.6 up to 24.1
- Parkway at the A4201: 25.5 up to 27.2
- Kentish Town Road: 24.9 up to 26.4
- Delancey Street at Parkway: 22.6 up to 23.5
- Jamestown Road: 18.2 up to 19.0
Read that carefully before drawing a conclusion. These are single-year moves of one to four micrograms on passive samplers, which is small. Two nearby streets went the other way: Parkway fell from 28.1 to 24.7, and Chalk Farm Road fell from 24.3 to 23.1. Borough-wide, 2025 was close to flat on 2024.
But the pattern is in the council’s own published figures, and we have not found a published council assessment of what displaced traffic has done to air quality on the surrounding streets. The consultation on making the closure permanent closed on 23 August. A decision has not yet been announced.
Nobody in Camden is near the 2034 target
Camden was the first council in the country to adopt the World Health Organization air quality guideline limits, which are stricter than the UK legal limits. It has committed to meeting them at every monitoring location by 2034:
- nitrogen dioxide: 10 µg/m³
- coarse particulate matter (PM10): 15 µg/m³
- fine particulate matter (PM2.5): 5 µg/m³
There are interim targets of 30 µg/m³ for nitrogen dioxide by 2026 and 20 µg/m³ by 2030. The draft plan scores progress against them using the 88 tube sites that have run continuously since 2019:
| Nitrogen dioxide target | 2019 | 2025 |
|---|---|---|
| Legal limit, 40 µg/m³ | 60 of 88 (67%) | 86 of 88 (97.7%) |
| Camden 2026 target, 30 µg/m³ | 14 of 88 (15.9%) | 78 of 88 (88.6%) |
| Camden 2030 target, 20 µg/m³ | 0 of 88 | 37 of 88 (42%) |
| Camden 2034 target, 10 µg/m³ | 0 of 88 | 0 of 88 |
The wider network says the same thing. Of all 337 sites with 2025 data, not one was at or below 10 µg/m³, and 141 were at or below 20.
The plan is blunt about the trend as well. Nitrogen dioxide and particulate matter have both come down since 2019, but “the rate of improvement has slowed down”. The easy win, ULEZ replacing older diesel and petrol engines, has largely been banked.
Where the pollution comes from now
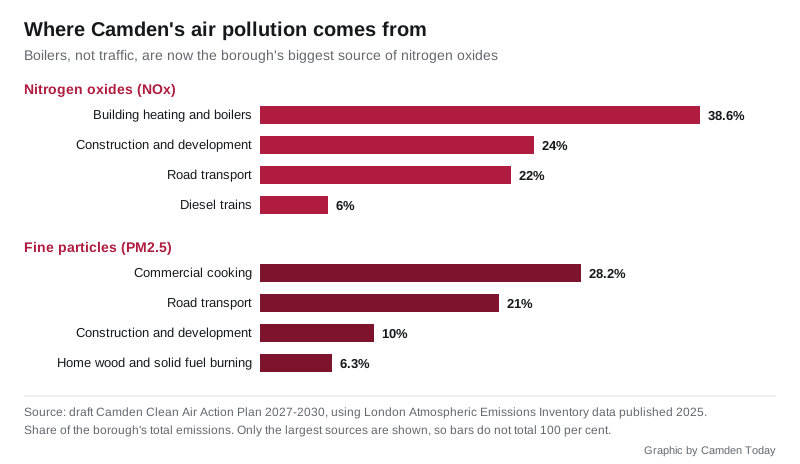
For nitrogen oxides, the plan puts building heating on 38.6 per cent, construction and development on 24 per cent, road transport on 22 per cent and diesel trains on about 6 per cent.
For fine particles, commercial cooking in restaurants, pubs, cafes and takeaways is the single largest source on 28.2 per cent. Road transport is on 21 per cent, construction on 10 per cent, and wood and solid fuel burning in homes on 6.3 per cent.
That reordering is the argument running through the whole draft plan. Cleaning up the traffic was the last decade’s job. Gas boilers, restaurant kitchens, construction sites and log burners are this decade’s, and the council has far weaker levers over all four.
The plan puts the human cost at more than 100 early deaths a year in Camden.
What it means for you
You have until Sunday 13 September to comment on the plan. This is the point at which the actions for 2027 to 2030 are still changeable. Three ways to respond:
- the survey on the consultation page
- email AirQuality@camden.gov.uk
- post to the Air Quality Team, Sustainability, Air Quality and Energy, 5th floor, 5 Pancras Square, London N1C 4AG
You can look up your own street. The diffusion tube dataset gives an annual reading for every one of the 400-odd sites, year by year, with the ward and the coordinates. Camden also publishes a map version and a monitoring overview.
Live readings are public. Camden’s automatic monitors, including the ones on Camden High Street, Euston Road and Kilburn High Road, report hourly to Air Quality England, as does the national monitoring station at London Bloomsbury.
You can borrow an indoor monitor. The plan confirms the council’s monitor loan project is open to anyone living in Camden, and it is being expanded. Indoor air is a named priority in the new plan, because most people spend up to 90 per cent of their time inside.
If you have a log burner, the plan singles it out. Wood and solid fuel burning in homes produces 6.3 per cent of Camden’s fine particle emissions, and the council argues it is avoidable because every home in the borough is on the gas or electricity network.
Our Camden roadworks and travel page tracks the current closures on Euston Road and the rest of the borough, and parking in Camden covers the Air Quality Surcharge and the controlled parking zones the plan leans on.
Sources
- Camden continues to make progress on cleaner air for all, Camden Council, 1 September 2026
- Draft Camden Clean Air Action Plan 2027-2030, consultation page, open 27 July to 13 September 2026
- Draft Camden Clean Air Action Plan 2027-2030, full plan (PDF, 105 pages)
- Draft Camden Clean Air Action Plan 2027-2030, quick overview (PDF)
- Camden Air Quality Diffusion Tubes, Camden Open Data, 399 sites, last uploaded 11 August 2026, analysed by Camden Today on 5 September 2026
- Camden Air Quality Monitoring, Camden Open Data
- London Borough of Camden monitoring sites, Air Quality England
Have your say